Plotly Interactive Chart Test
The content below was generated entirely by machine translation. Please verify its accuracy. If anything is unclear, consult the Chinese source version.
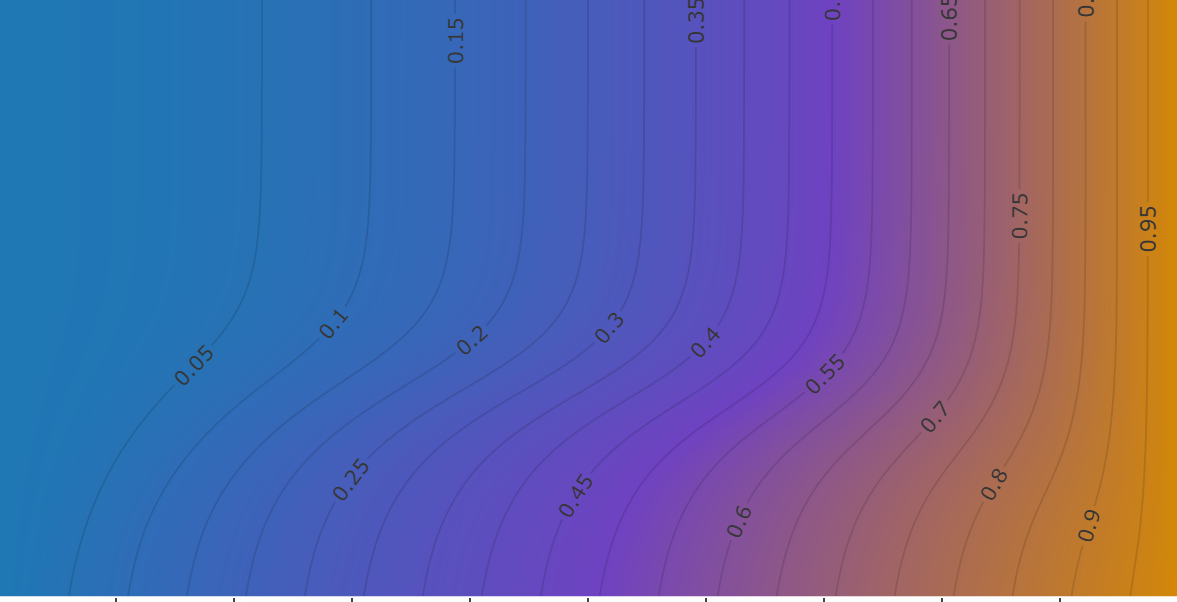
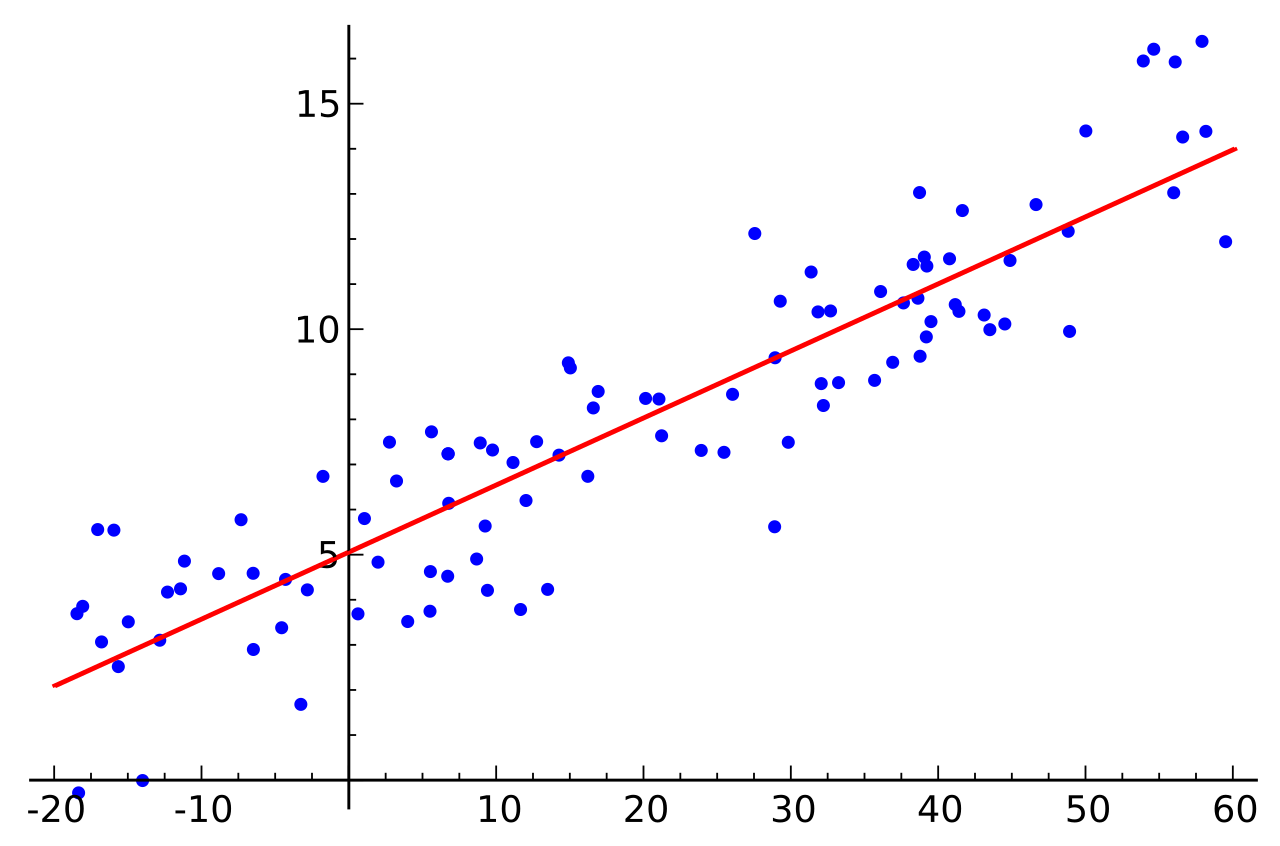
The curve below represents
Drag the sliders to change the amplitude and frequency in real time.
Loading chart...
All articles on this blog are licensed under CC BY-NC-SA 4.0 unless otherwise stated.