How Function Calls Work and What They Enable
The content below was generated entirely by machine translation. Please verify its accuracy. If anything is unclear, consult the Chinese source version.
Update on 2022/12/18: thank you to @adpitacor and @iterator_traits for pointing out several typographical errors in the comments. They have now been corrected.
Update on 2022/11/24: I was surprised that this article was selected for Luogu Daily. I also feel that my older writing was not very strong, but since it was selected, I want to improve it as much as possible. I cannot rewrite the entire article, but I can add things learned since then, such as stack-overflow attacks and a backtrace implementation, so I added them before publication.
This update also corrected typographical errors, primarily thanks to @cancan123456. Many Luogu readers offered corrections and suggestions. @szTom mentioned shadow space in __fastcall; @LiuTianyou introduced forced inlining, which the newly added section uses; and @小菜鸟 mentioned longjmp, which relates to returning through several functions at once. I am very grateful. As I learn these topics, I may add them gradually. I also want this article to be as understandable as possible, so please contact me if any wording is ambiguous or too concise.
1. How Is a Function Call Implemented?
1.1. A small example
1 |
|
In this program, main calls add1; add1 calls add2 and uses its result; only afterward does main execute printf.
Compare the completion order, , with the starting order, . A function that begins earlier ends later because it depends on the result of the function it called.
This is a stack, a last-in, first-out structure. In function calls, the latest function to begin is the first to finish.
We can abstract each invocation as one stack element. The CPU executes the function on top. A newly called function is pushed; a completed function is popped.
The following Manim video demonstrates the process:
1.2. Stack frames
1.2.1. Basic structure
The stack element representing one function invocation is a stack frame. What must it contain for the CPU to execute the function correctly?
First, a function may declare local variables. Successful execution requires access to them. Passed arguments can also be considered local variables.
Second, after the called function finishes, execution must return. The computer otherwise does not know which instruction follows. In the example, after add1, should it execute printf or jump directly to return 0? The frame must store a return address, the instruction to execute after returning.
Finally, an array-based stack needs a pointer to its top to know where the next element belongs. A frame needs both its end and its beginning so that popping it restores the preceding frame correctly.
On x86 and x86-64, two registers mark the beginning and end of the current frame: xbp, the base or frame pointer, and xsp, the stack pointer. The x depends on machine width: rbp and rsp on 64-bit machines, ebp and esp on 32-bit machines.
This diagram[1] shows the stack-frame layout:
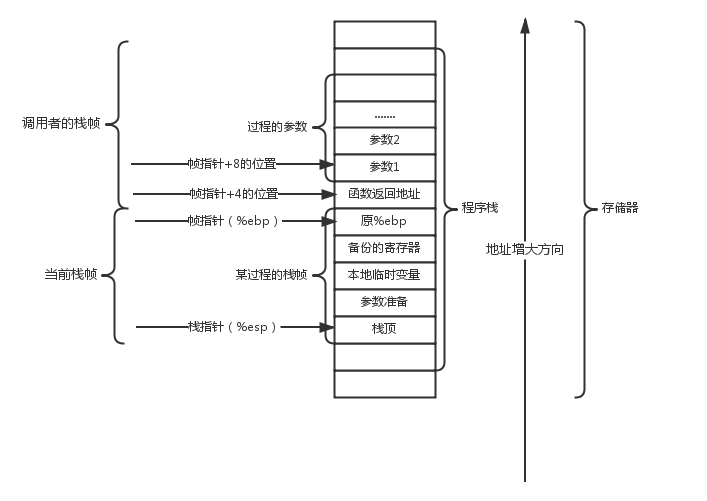
The stack grows from high addresses toward low addresses, so a callee frame occupies lower addresses than its caller.
The upper part is the caller frame. It contains arguments and the current function’s return address. On a 64-bit system, the saved return address is located at frame pointer plus eight bytes; on the illustrated 32-bit system, it is plus four.
The lower part is the current function’s frame, containing local variables. ebp and esp mark its beginning and end. Local variables are accessed through offsets from the frame pointer.
This organization is not merely a drawing convention. During nested calls, each function keeps its own locals in a separate interval of the same stack. The saved frame pointer links the current interval to the caller’s interval, while the saved return address links the callee’s completion to the exact instruction sequence that the caller must resume. Consequently, walking saved frame pointers traverses callers, and fixed offsets from the active frame pointer retrieve this invocation’s variables without confusing them with identically named variables in another invocation.
1.2.2. Frame changes during a call
- Push the return address, the value of pc[2] at the call.
- Push the old frame pointer so it can be restored later.
- Begin the callee frame. Since it is initially empty, its beginning and end both equal the old stack end. Set the frame pointer to the current stack pointer.
- Reserve space for locals and arguments. Because the stack grows downward, subtract their required size from the stack pointer.
- Store local data and execute the function. The new frame is complete.
1.2.3. Frame changes during return
- Release all memory used by the frame by setting the stack pointer equal to the frame pointer, undoing step four above.
- Pop the saved old frame pointer into the frame-pointer register.
- Pop the return address into pc.
- Continue the caller according to pc.
1.2.4. Video explanation
The text may be unclear, so the following Manim video demonstrates frame changes for this C program.
For demonstration, assume every source line corresponds to one CPU instruction. Real assembly requires more instructions, discussed later.
1 | int add(int a, int b) |
1.2.5. Talk is cheap. Show me the code.
The explanation and video convey the general principle, but assembly is necessary for the exact process. Do not worry if assembly is unfamiliar; this section explains it in detail.
1.2.5.1. Viewing assembly
There are two convenient methods:
- With GCC, run
gcc -S [file]. It emits AT&T syntax by default. I prefer Intel syntax, which can be requested with-masm=intel. - Compiler output can contain system-related code unrelated to the program, and beginners may not know which assembly corresponds to one C line. Compiler Explorer solves both problems.
1.2.5.2. Compiler Explorer basics
Its basic interface looks like this:
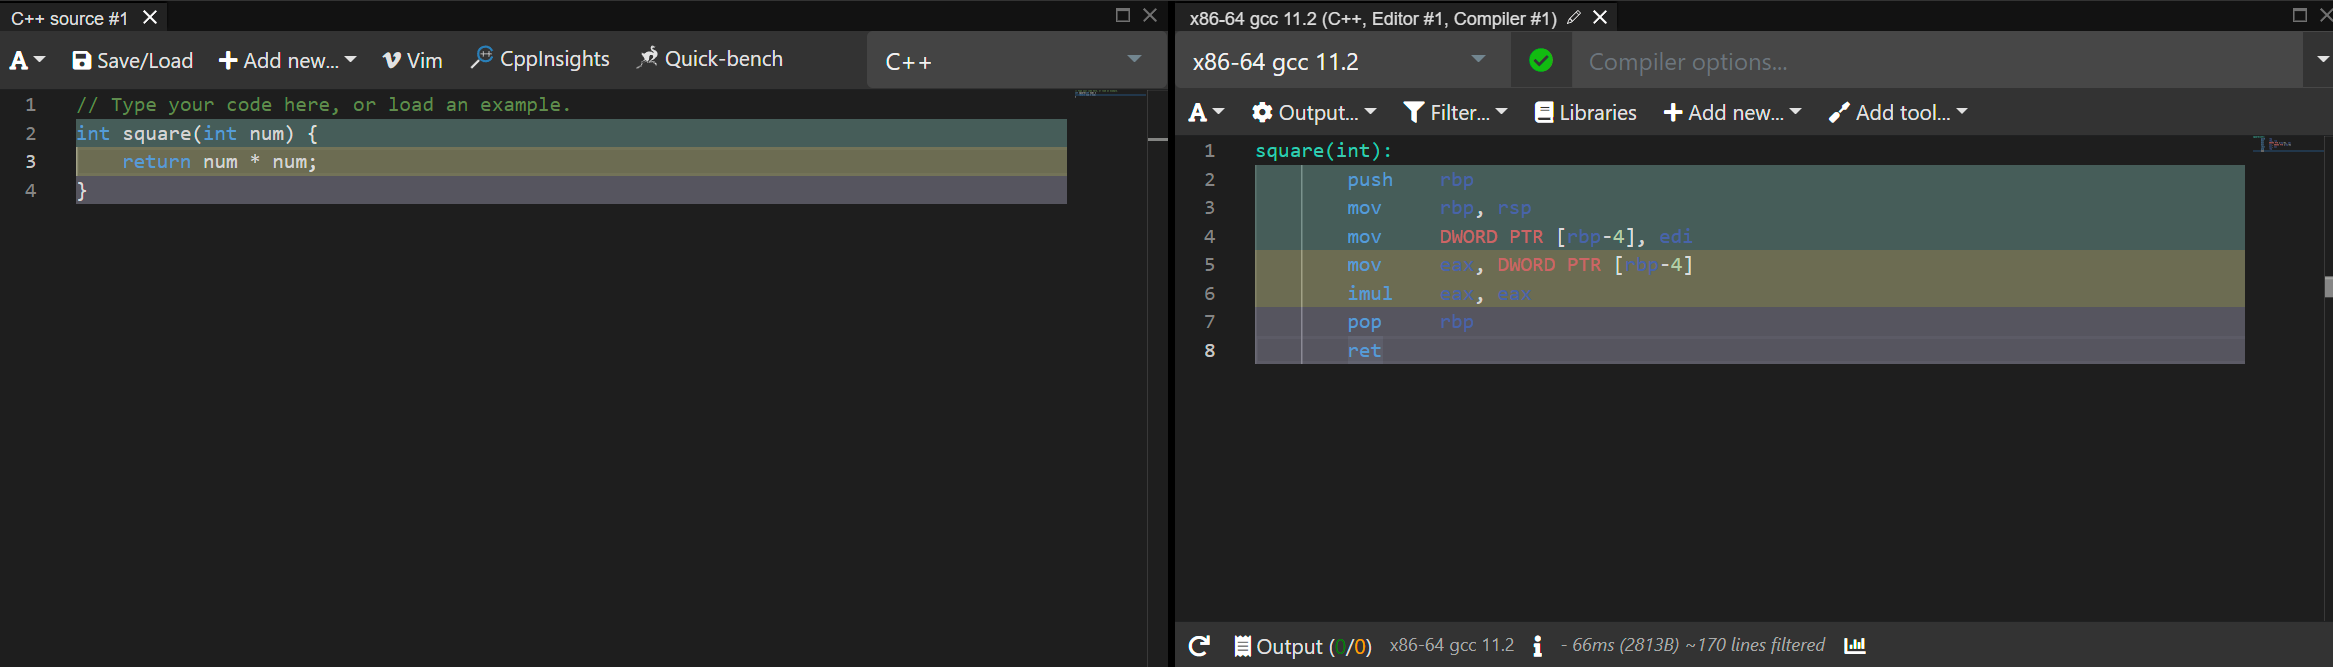
I will mention only basic options, although the site is effectively a powerful online IDE. See this video.

From left to right, the highlighted controls:
- Enable Vim editing mode.
- Choose a language; more than thirty are supported.
- Choose a compiler or interpreter. C and C++ choices include embedded Xtensa targets and IBM Power architectures.
- Select output, including Intel versus AT&T assembly or a binary file.
- Filter content unrelated to the source.
- Add compiler options.
- Share through a link.
Returning to the first screenshot:
The C++ and assembly lines use matching colors; lines with the same color correspond.
1.2.5.3. Analyzing call assembly
1 | add: |
1 | int add(int a, int b) |
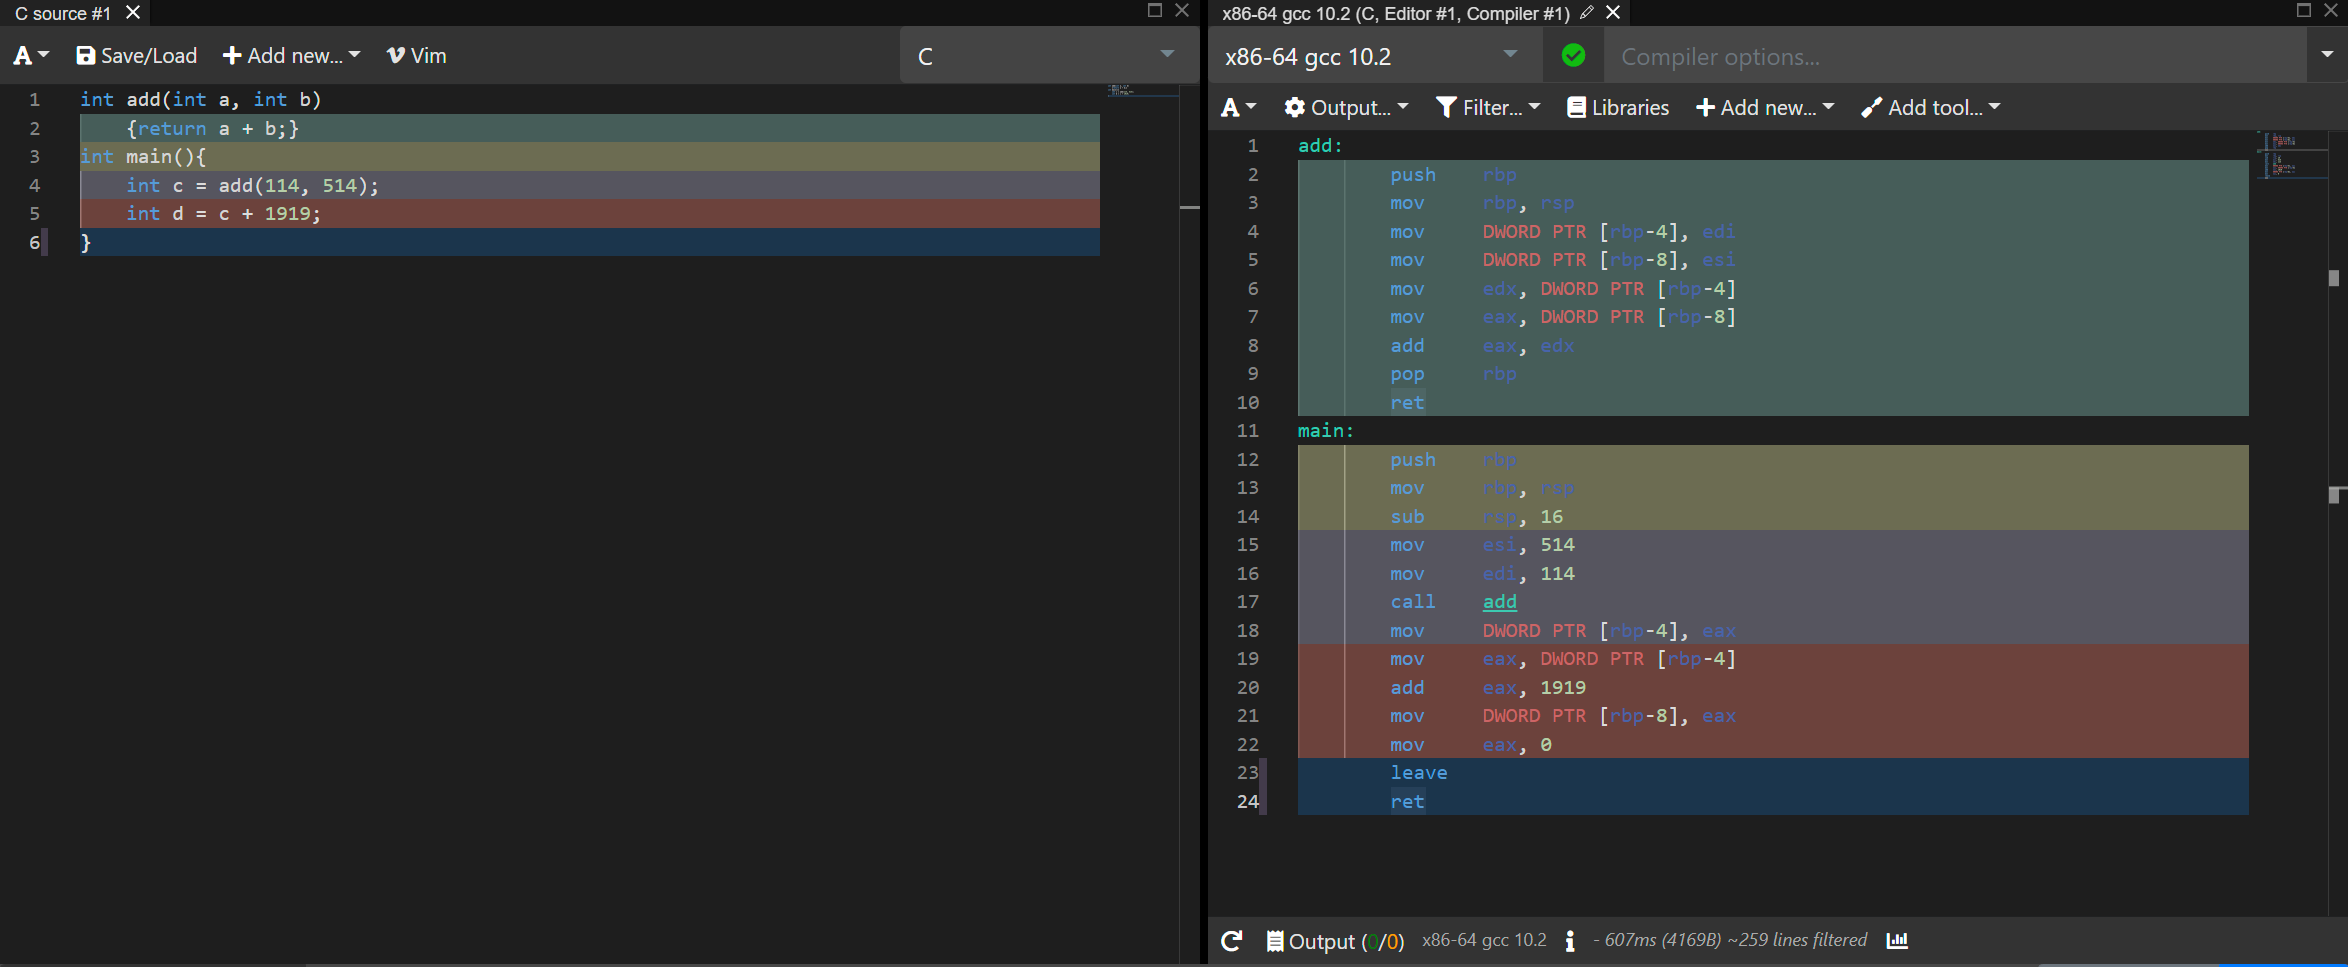
main calls add through int c = add(114, 514);. One C statement requires:
1 | mov esi, 514 ; Assign 514 to esi to pass an argument to add |
The first two mov instructions pass arguments. call performs two operations: it pushes the address of the following instruction, then changes pc to the beginning of add. The CPU starts executing add.
The pushed address is the location of mov DWORD PTR [rbp-4], eax, not the address of call itself. This distinction lets ret continue after the call instead of invoking add repeatedly. Although a C call looks atomic, argument preparation, saving the continuation, transferring control, creating the callee frame, computing the result, restoring the frame, and resuming the caller are separate machine-level actions.
The final line is less obvious, especially DWORD PTR [rbp-4]. WORD is a two-byte integer; DWORD, double word, is four bytes, equivalent to C int here.
PTR resembles dereferencing in C. mov DWORD PTR [rbp-4], eax copies four bytes from eax into memory beginning at rbp-4.
rbp is the frame pointer, and local variables are addressed relative to it. eax contains the return value from add, so this line stores add(114,514) into local variable c.
Now inspect add:
1 | add: |
Earlier, stack allocation subtracted from sp, and return restored sp from bp. Those operations are absent because the compiler optimized away unnecessary work.
sp matters for placing another frame without overwriting this one. add calls no other function, so it does not need additional stack space. Since sp never changed, return does not need to restore it.
Try adding -O2 in Compiler Explorer. The compiler calculates at compile time and removes the call to add entirely.
If add becomes recursive, these optimizations cannot apply because recursive frames would overwrite one another. See this example. leave combines mov rsp, rbp with pop rbp: it releases frame space and restores the old frame pointer.
1.3. Calling conventions
Many assembly designs could implement a call. Why does the compiler choose this specific one? Why do edi and esi pass arguments instead of the stack or other registers? Why does the callee, rather than caller, release this frame?
Calling conventions answer these questions.
A calling convention describes how arguments are passed to a called function, how return values are returned, and which side balances the stack.
The following are several classic conventions that handwritten assembly can also follow.
1.3.1. x86 32-bit conventions
GCC normally emits 64-bit assembly. Add -m32 for 32-bit output. On my MinGW system it works, and source can use annotations such as __cdecl or __stdcall. Compiler Explorer behaved strangely and did not honor the convention under GCC even with -m32, so I selected MSVC instead. If you know why GCC there rejects it, please comment.
I use the same code for comparison and place a different convention annotation before add. The Compiler Explorer link is here.
1 | int add(int a, int b, int c) |
Declare int __cdecl add(int a, int b, int c) to select cdecl.
cdecl is the default 32-bit C convention:
- Arguments are pushed on the stack from right to left.
- The caller releases the callee’s argument space, manually balancing the stack.
- Integer returns use ax; floating-point returns use st0.
The generated assembly is:
1 | _a$ = 8 ; size = 4 |
Notice:
1 | push 1919 ; 0000077fH |
Arguments are pushed right to left. push already decreases esp while storing data, so add does not separately subtract stack space.
As in section 1.2.5.3, some frame work is optimized because add calls no other function.
add esp, 12 releases the twelve bytes occupied by arguments. It appears in main, demonstrating that cdecl makes the caller clean the stack.
The callee can use those arguments while it runs because ebp provides a stable base. The symbolic operands _a$[ebp], _b$[ebp], and _c$[ebp] refer to positive offsets where the caller placed the values. Once add returns, the caller no longer needs those slots and moves esp upward by twelve bytes. Repeating cleanup at each cdecl call site is intentional because each site knows exactly how many arguments it supplied.
The main benefit is variadic arguments. Common C examples are printf() and scanf(). int printf(const char *__format, ...) uses the three dots to denote a variable count. For more, see this Luogu Daily article.
A variadic callee does not generally know a fixed amount of argument space to release. Its callers know the count and sizes for each invocation and can clean exactly the right amount. Other designs could pass the size in a register or split cleanup, but no standard C/C++ convention here does so.
Declare int __stdcall add(int a, int b, int c) to select stdcall.
Most Win32 APIs use stdcall:
- Arguments are pushed right to left.
- The callee releases its argument space automatically.
- Other behavior resembles cdecl.
1 | _a$ = 8 ; size = 4 |
The push order is identical:
1 | push 1919 ; 0000077fH |
The difference is ret 12 inside add, equivalent to add esp,12 followed by ret. The callee releases its own twelve bytes.
This can reduce program size when the parameter count is fixed: cleanup is identical at every call site, so it appears once in the callee rather than after every call.
The 12 encoded in both the decorated name _add@12 and ret 12 corresponds to three four-byte arguments. Unlike cdecl, a caller cannot freely vary that number for the same stdcall function because the callee always removes the fixed amount it expects. This tradeoff explains both compact cleanup and why cdecl is a more natural fit for variadic functions.
Declare int __fastcall add(int a, int b, int c) to select fastcall.
fastcall improves speed by passing arguments in registers. Unlike cdecl and stdcall, it has no single implementation across compilers. These properties follow the Visual Studio 2022 convention:
- The first two left-to-right integer arguments of 32 bits or less use ecx and edx; remaining arguments are pushed right to left.
- The callee releases stack space as in stdcall.
1 | _b$ = -8 ; size = 4 |
Observe:
1 | push 1919 ; 0000077fH |
The first two arguments, 114 and 514, use registers; 1919 is pushed. ret 4 shows callee cleanup. Only one four-byte argument occupied stack space.
Inside add, the compiler stores ecx and edx into local stack slots before doing arithmetic. Passing an argument in a register does not mean it can never appear on the stack; it means the ABI transfers it across the call boundary in a register. The callee may still spill it. The third argument is already available at a positive frame offset because the caller pushed it.
1.3.2. x64 conventions
x86 has only eight general-purpose registers, so many conventions pass most arguments through the slower stack. x64 has sixteen, enabling register-heavy conventions similar to fastcall.
The two main x64 families are Microsoft’s convention and the System V AMD64 ABI. I focus on System V, used by Solaris, GNU/Linux, FreeBSD, and other non-Microsoft systems. For Microsoft x64, see this page.
The earlier stack-frame assembly already follows System V, whose primary rules include:
- The first six integer and pointer arguments use RDI, RSI, RDX, RCX, R8, and R9 from left to right.
- The first eight floating-point arguments use xmm0 through xmm7.
- Remaining arguments are pushed right to left.
- The callee restores its own frame.
Calling conventions also enable cross-language calls. They specify caller and callee responsibilities and the parameter representation. When both languages obey the same ABI, one can call code written in the other. Python’s ctypes library, for example, needs a convention when loading a C dynamic library.
Additional references:
2. Experiments Enabled by Understanding Calls
2.1. Backtrace
2.1.1. Introduction
I am unsure of the exact Chinese translation, so I simply use “call backtrace.”
Backtracing is a common debugging technique. When a bug appears, we want to know which function contains it. That alone is insufficient because many locations may call the same function; we want the entire call relationship. GDB’s backtrace, abbreviated bt, provides it.
Consider:
1 |
|
Dereferencing address zero in add1 causes a segmentation fault because zero is NULL. Set a GDB breakpoint at add1 and execute bt:
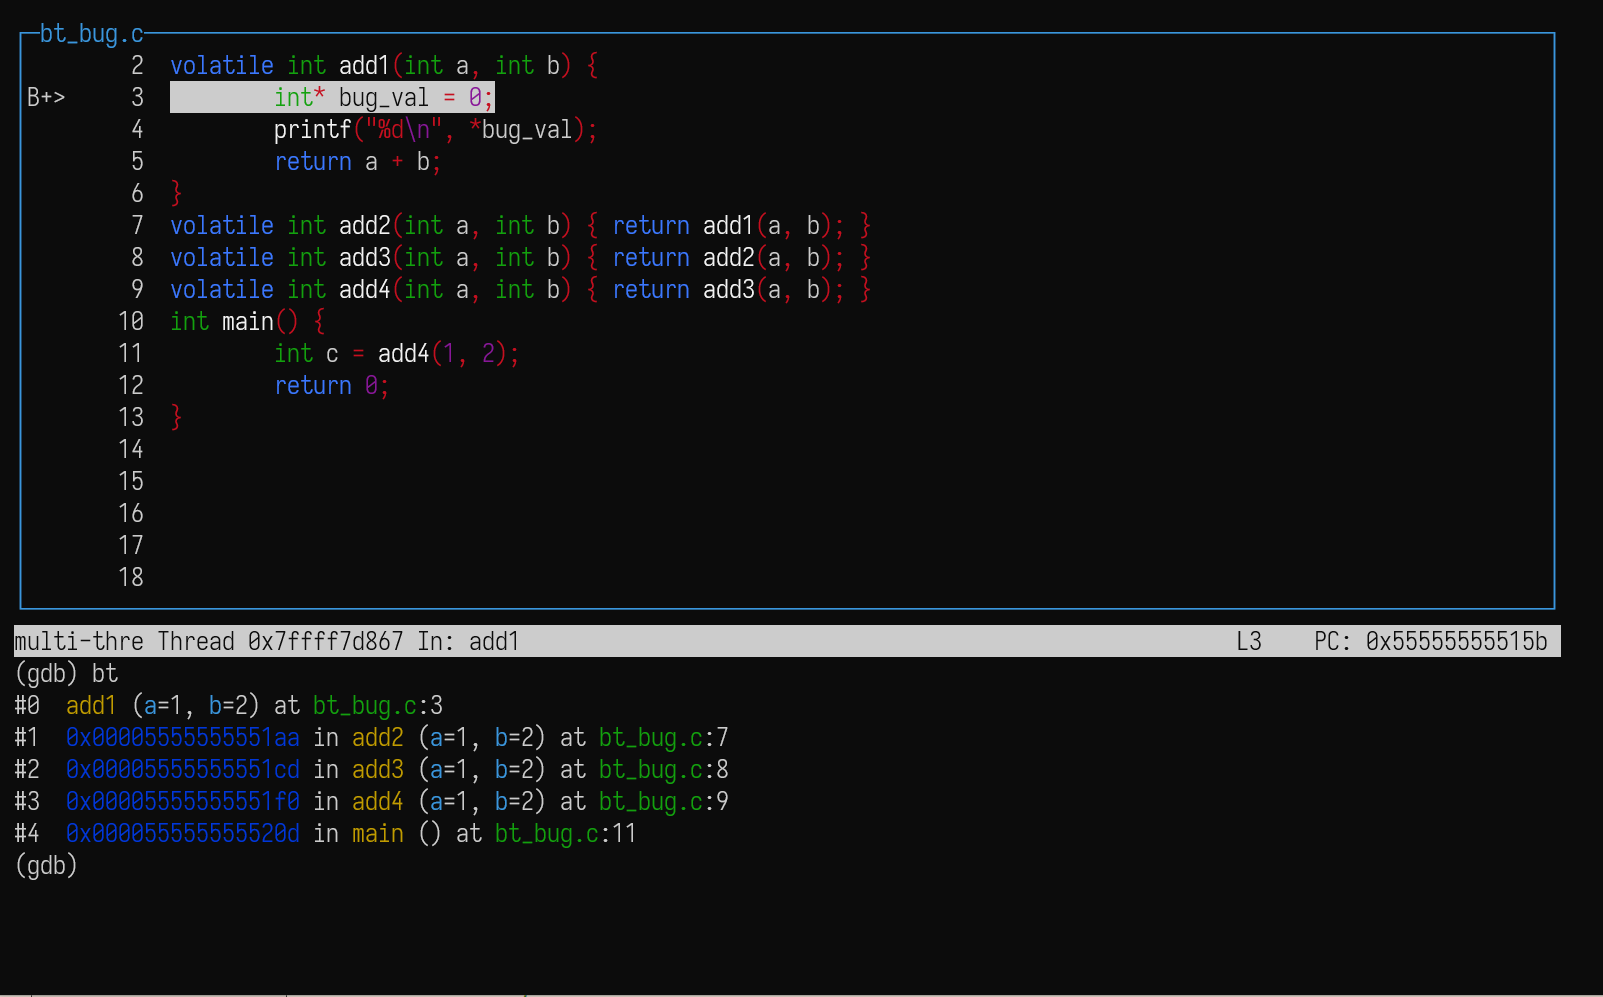
The relationship is:
1 | #0 add1 (a=1, b=2) at bt_bug.c:3 |
2.1.2. A simple implementation
Can we implement a simplified version that prints only addresses?
All necessary information is hidden in stack frames. Addresses such as 0x...51aa are return addresses. In the stack diagram, the return address lies one word above the frame pointer, bp plus eight bytes on x64. Traversing frames yields every return address and therefore the call chain.
Each reported address identifies a continuation in the caller rather than necessarily its first instruction. Debug information and the executable symbol table let tools map that continuation back to a function name and source line. This is why GDB can display both add2 and a line number while the simple implementation below initially sees only raw addresses.
At bp plus zero is the preceding frame’s frame pointer. Following these pointers recursively walks the chain, which illustrates the name backtrace.
Two questions remain:
- What terminates traversal?
- How can C read the bp register?
Termination differs by system. In my Ubuntu 22.04.1 on WSL2 environment, the preceding pointer eventually becomes 0x1. I do not know whether Linux specifies this; I observed it while debugging.
In xv6, used by MIT 6.S081, a kernel stack occupies one page, so traversal ends when the pointer leaves that page.
If you know a portable method, please comment.
For the second question, GCC’s __builtin_frame_address can return the current frame pointer.
To experiment with nonstandard GCC features, use inline assembly:
1 |
|
In "mov %0, rbp" : "=r"(x), the first string is a template. GCC replaces %0 with the register assigned to output variable x. It means: copy rbp into the register holding x.
For inline assembly, see the GCC constraints documentation and my more detailed Lab 4 article.
The code also uses:
1 |
inline alone only suggests inlining and does not guarantee it.[4] __attribute__((always_inline)) inline forces GCC to inline. __attribute__ has many other uses described in the documentation.
Forced inlining matters specifically for r_bp(). If it remained a separate function, reading rbp would obtain the frame pointer of r_bp itself rather than the frame that invoked the backtrace logic. Inlining places the assembly in its caller, making the observed register correspond to the intended starting frame. -masm=intel is also required because the template uses Intel operand order.
The rest mainly involves pointers:
1 | FORCE_INLINE void* r_bp() { |
2.1.3. Adding function names
The simple version prints only addresses, while GDB shows names. How can an address be converted into a function name?
Linux provides addr2line, although I had trouble using it successfully.
Another method is backtrace_symbols from execinfo.h. It converts an address array into a name array:
1 | /* Return names of functions from the backtrace list in ARRAY in a newly |
Compile with -rdynamic so the linker places symbols in the dynamic symbol table. The original explanation is from this source:
https://stackoverflow.com/questions/6934659/how-to-make-backtrace-backtrace-symbols-print-the-function-names
The symbols are taken from the dynamic symbol table; you need the -rdynamic option to gcc, which makes it pass a flag to the linker which ensures that all symbols are placed in the table.
The complete program is:
1 |
|
Compile with:
1 | gcc backtrace.c -o bt -masm=intel -ggdb3 -rdynamic |
Running ./bt produces:
1 | ./bt(add1+0x32) [0x55bfc409e25b] |
Of course, this is intentionally reinventing the wheel: execinfo.h already contains a function named backtrace().
2.2. Stack-overflow attack
The idea comes from this video.
A stack-overflow attack can execute a function without explicitly calling it:
1 |
|
Compile using:
1 | gcc stk_ov.c -o stk_ov -fno-stack-protector -ggdb3 -masm=intel |
The program prints hello world. This is dangerous: modifying the stack can redirect execution to malicious code. Modern compilers defend against it, so without -fno-stack-protector this program is stopped.
Why does malfunc execute? Draw the set_arr() frame:
1 | Low addresses |
a[3] overlaps the stored return address of set_arr. Replacing it with malfunc naturally redirects return there.
Why does malfunc contain pop rbp? I honestly do not know.
Without it, the program runs in Compiler Explorer, as this link shows.
Locally, omitting the instruction causes a segmentation fault. I described the case in this Stack Overflow question. Please answer there or in the comments if you understand it.
3. Writing a Nonrecursive DFS for a Tree
3.1. Implementation
We now understand how calls work. The simplest way to implement a nonrecursive DFS is to simulate the assembly call process ourselves.
Start with the familiar recursive DFS:
1 |
|
Its local variables or parameters are cur and fa, the current node and parent.
The recursive loop has an implicit execution position as well. When DFS calls itself for one neighbor, the caller must later return to the loop, advance to the next edge, and continue. The simulated pc makes that hidden continuation explicit. Storing only cur and fa would be insufficient: returning from a child would restart the parent at its first statement and repeatedly revisit the same edge.
A frame contains locals, the saved bp, and the return address pc. Saved bp lets the caller restore its frame pointer and access its own locals correctly.
Instead, encapsulate each frame in a structure and represent the full call stack as an array of those structures. Then bp need not be stored because each frame’s fields remain directly accessible.
This frame contains only pc, representing where execution should continue, and the function parameters. DFS must preserve pc because it calls another function before the current one finishes and must later continue rather than restart:
1 | template <typename PARA_TYPE> // PARA_TYPE is the argument type |
Simulate stack operations:
1 | template <typename FRAME_TYPE>// Frame type |
Finally combine the two concepts:
1 | template <typename PARA_TYPE> |
Use these structures according to the assembly process:
- Calling a function pushes a new frame through
Func_stk::call. - Returning pops a frame through
Func_stk::ret. - Otherwise, execute the statement selected by pc.
- Increment pc after every statement.
The interpreter loop always refreshes cur_frame from the stack top. A call may push a new frame, so retaining a pointer to the old top would execute the caller when the callee should be active. A return pops the current top and exposes its caller. Refreshing the pointer plays the same role as restoring sp and the frame pointer during a machine-level call or return.
The DFS becomes:
1 | void dfs(int cur, int fa){ |
The complete program follows. You are welcome to copy and run it:
1 |
|
3.2. Small optimization
The original recursive DFS is:
1 | int dfs(int cur, int fa){ |
The new call shares one parameter with the current call: the next function’s fa is the current cur. Instead of storing fa, access cur in the preceding frame, such as dfs_stk.stk[dfs_stk.sp-1].paras after making paras a single integer.
This saves some space.
3.3. Is it useful?
It is mainly educational and deepens understanding of calls, although it has a few possible uses.
3.3.1. Test method
To compare it accurately with normal DFS, I used Python and Luogu’s CYaRon generator to create ten tests, each a tree with nodes.
Generator:
1 | from cyaron import * |
Answer generator:
1 |
|
I created a Luogu problem and uploaded the data. All following tests use it.
3.3.2. Space?
In theory, after the optimization, the nonrecursive DFS should use about 4 MB less: one fewer int in each of up to frames, plus no saved bp.
I submitted the conventional DFS for comparison:
| Time (s) | Memory (MB) |
|---|---|
| 9.06 | 55 |
See the submission list.
What happened in reality? The experimental version used 62 MB and 9.2 seconds—both worse.
See the submission.
I suspect the array-based stack. Although each frame is smaller, popped array slots remain allocated and much reserved memory is unused. A normal recursive frame is released immediately when popped.
More precisely, a fixed-capacity array reserves space for the worst possible depth throughout execution, even when the traversal is shallow most of the time. Popping changes only the simulated index and cannot return that reserved storage. A native stack also reserves an address range, but committed pages and judge accounting can behave differently, while an STL stack dynamically allocates and releases blocks at additional runtime cost.
Using an actual dynamic stack should test this. STL stack produced the same memory usage as recursion, but took 10.26 seconds. Submission.
I still do not know why memory was not lower than recursion; please comment if you do.
3.3.3. Time?
Why is time slower? In theory, simulated calls should be faster because pushing and popping only increments or decrements a stack index, while normal calls perform the steps from sections 1.2.2 and 1.2.3.
I eventually inspected the assembly.
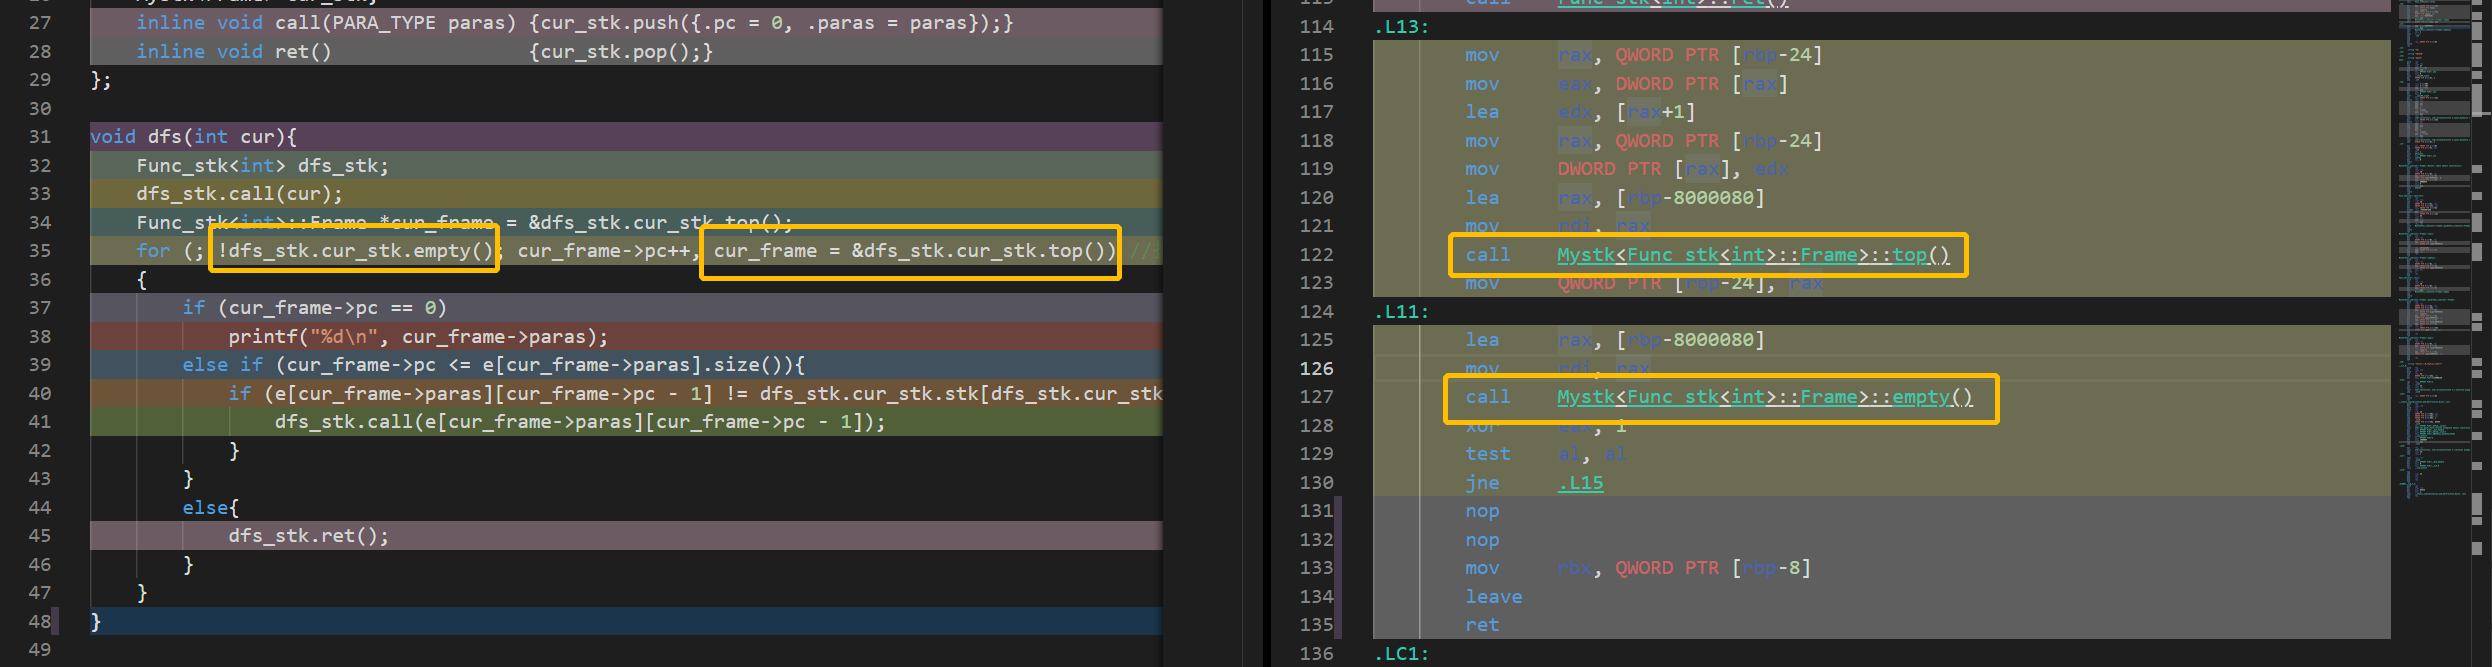
The circled source and assembly correspond. At first glance the functions are simply called normally.
But I marked them inline:[3]
1 | inline FRAME_TYPE& top() {return stk[sp];} |
If inlining was ignored, the calls I expected to remove have returned and may even add overhead.
inline is only a suggestion. The compiler may decline, although these functions seem exceptionally simple.
Replacing them with macros guarantees textual inlining. The result was 8.83 seconds and 63.16 MB. Submission. It saved about 0.2 seconds, at the cost of many extra lines.
3.3.4. Unusual operations
3.3.4.1. Returning through multiple function levels
In normal recursion, one return pops one frame and resumes the caller. When simulated frames give us complete control, why not pop several at once?
Suppose recursive brute force finds the answer deep in the search. Normally, every recursive level must return in turn. With simulated frames, clear all preceding frames or simply break from the interpreter loop.
To test performance, I uploaded another Luogu problem: a grid whose cells are zero or one, representing blocked and passable positions. Determine whether eight-direction movement can reach from while printing visited positions in DFS order.
Input generator:
1 |
|
A nonrecursive DFS can exit immediately after reaching the target; recursion unwinds one level at a time. Perhaps it should be faster.
Results:
| Conventional DFS | Nonrecursive, array stack | Nonrecursive, STL stack | |
|---|---|---|---|
| Submission | Record | Record | Record |
| Time (s) | 7.77 | 9.53 | 10.50, TLE |
| Memory (MB) | 512+, MLE | 335.54 | 187.01 |
The result was unexpected. Conventional DFS ran faster on earlier tests but exceeded memory on the final one. Compared with an STL stack, nonrecursive DFS significantly reduced memory here. The large array-stack memory was explained above.
These tests still do not isolate unwinding versus immediate return, so I measured only return time using chrono, whose nanosecond precision exceeds clock().
The flattering interpretation is that direct return was about 500 times faster. The less flattering one is that unwinding took only 50,000 nanoseconds, or 0.05 milliseconds. Return cost also depends on the return type; an exceptionally deep recursion returning a huge object might show a meaningful difference, but such a case is rare.
3.3.4.2. Reading caller locals and other operations
The small optimization already used this idea. When every frame is stored in one stack, an array implementation can access local variables in previous frames. Tree DFS can use the caller’s cur instead of storing another fa.
Likewise, just as any number of frames can be popped, one simulated function can push any number of calls at once. I have not found a useful application for that strange operation.
3.4. Summary
Nonrecursive DFS has more educational than practical value. It may occasionally improve constants, but writing it takes much longer. With -O2, even its small constant advantage often disappears. Unless a problem is extremely tight and forbids both BFS and optimization, avoid this odd technique.
Its potential optimizations depend on the special nature of recursion: every invocation has the same frame structure and size, allowing a structure to represent frames and simplify calls.
The unusual operations also depend on complete control of those uniform frames. Outside recursion, frames have different layouts and sizes, so arbitrary access and manipulation are not generally possible.
Questions and suggestions are welcome in the comments or through direct contact.
- 1.Source: https://www.cnblogs.com/zzdbullet/p/9629909.html ↩
- 2.pc means program counter, which points to the memory address of the next instruction. ↩
- 3.C and C++ introduced
inlineto reduce repeated stack overhead from frequently called small functions. It effectively places a function body at its call site. Source ↩ - 4.A later section says inline does not force inlining. The backtrace section was added in November 2022, after I learned forced inlining. Thanks again to @LiuTianyou for the comment. ↩